

nce online, our every movement, every click, sent or received email, our every activity produces a vast amount of invisible traces. These traces, once collected, put together and analysed, can reveal our behavioral patterns, location, contacts, habits and most intimate interests. They often reveal much more than we feel comfortable sharing.
Most of those traces are hidden in metadata, i.e. tiny pieces of information stored in IP packets, headers of your emails or files that you are creating.
There is an ongoing debate over the significance of metadata. We wanted to question а somewhat heretical argument that bulk metadata contain sensitive information about private life of internet users and confront it with a ruling opinion that such statement is overrated. We have therefore undertaken the following social and scientific experiment using different methodologies. The purpose of this research is to investigate and consequently inform the scientific and popular audience about the real importance of metadata for our privacy.
In our previous research we explained how metadata is being collected and accessed by numerous actors – government agencies, Internet service providers, Internet companies such as Google or Facebook, data dealers or producers of mobile phone applications. We explained the invisible infrastructure behind data flow, but we never had a chance to investigate what these actors can really do when they have access to a vast amount of metadata about you. This data investigation is exactly about that.
This story is about the power of Metadata.
Our little “Big Data”
We were given this pile of data and soon we REALISED there was another gem hidden in it. We were able to extract a substantial amount of metadata – headers from hundreds of thousands emails from their database. We got our own little portion of Big data and that is where our research began.
Do It Yourself Metadata Investigation
The concept behind data-mining and analysis operation performed by the government agencies around the world is that metadata can be analysed to reveal connections between people, and these links can generate significant investigative leads.
This is not exclusively done by government agencies, our metadata is constantly collected and examined by major Internet companies such as Google and Facebook, but for the purpose of profiling of users and transforming our behavior into profit, which reaches tens of billions US dollars per annum.
Thanks to Edward Snowden’s revelations in June 2013 we got insight into the NSA Stellar Wind, Boundless Informant, PRISM and XKeyscore programs. One of the scopes of those programs was collecting and analysing large amount of email metadata. Analysis involve operations such as contact chaining, building a network graph that models the communication (e-mail, telephony, etc.) patterns of targeted entities (people, organisations, etc) and their associates from the communications sent or received by the targets.
NSA IG-DRAFT REPORT
Edward Snowden
In some kind of reverse engineering process we explored the possibility of using their own methodology for an independent data investigation of the Hacking Team, one of the “CORPORATE ENEMIES OF THE INTERNET”.
Investigation process
Email Metadata : Building blocks for our investigation
Let’s begin with a short explanation of our little treasure – email headers. Every email consists of three components: the envelope, the header, and the body of the message. The envelope is a part of the internal process by which an email is routed, the body is the actual content of the message and the header, the third component of an email, is the point of interest of our research.
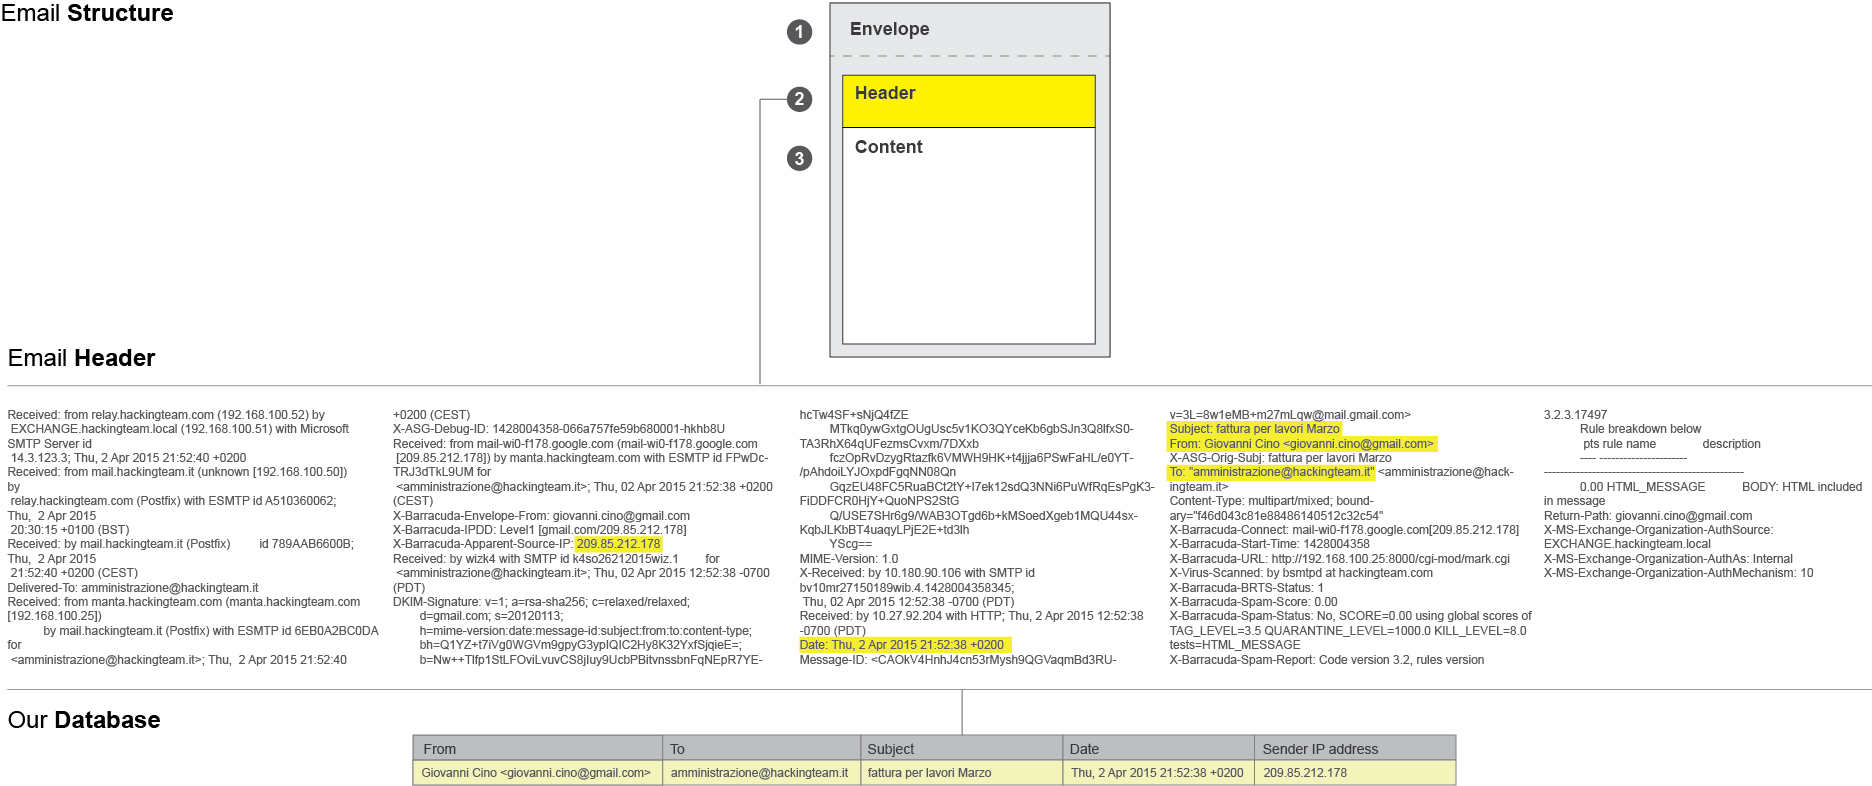
Headers identify particular routing information of the message, including the sender, recipient, date and subject, sending and receiving time stamps. In some cases email headers also contain the IP address of the sender and information on the route an email takes as it is transferred from one computer to another.
 Tools : Export from MS Outlook Code Two Outlook Export > Data processing MS Excel
After extracting data from around 60 accounts and hundreds of thousands emails of Hacking Team employees, we got a database we could work with.
Needles in a haystack
The first step we took in exploring this pile of data was to perform a Social Network Analysis, a strategy for investigating social structures based on network and graph theories. It characterises networked structures in terms of nodes (individual actors, people) and ties or edges (relationships or interactions) that connect them. In our case, the network graph represents an analysis of all email headers exchanged between Hacking Team employees and their contacts between 2012 and 2015. Even at this very begining of the investigation we were able to detect the main internal and external actors and ties, more precisely by the amount of exchanged emails between them.
By selecting the individual nodes, we are able to explore their individual social ties and contacts.
Social network Analysis of hacking team email database ( period 2013-2015 )
Tools : Social Network analysis with Gephy exported with Sigma.js by Oxford Internet Institute
By filtering out the nodes with less than a 100 exchanged emails, we isolate the internal Hacking Team communication and get a closer look at their internal structure based solely on it.
Social network analysis of nodes with +100 exchanged emails
TOOLS : SOCIAL NETWORK ANALYSIS WITH GEPHY EXPORTED WITH SIGMA.JS BY OXFORD INTERNET INSTITUTE
Giving that this was somewhat a learning process of our own, while exploring the metadata we came to notice that our understanding of data and leads we got from it highly depended on the type of visualisation we applied to the data set. Sometimes ties between different actors were more successfully, more clearly revealed by using different visualisations. Like in this example, where we see the same data set as the one presented above, but this time in the form of a heat map.
Heat-map of internal communication
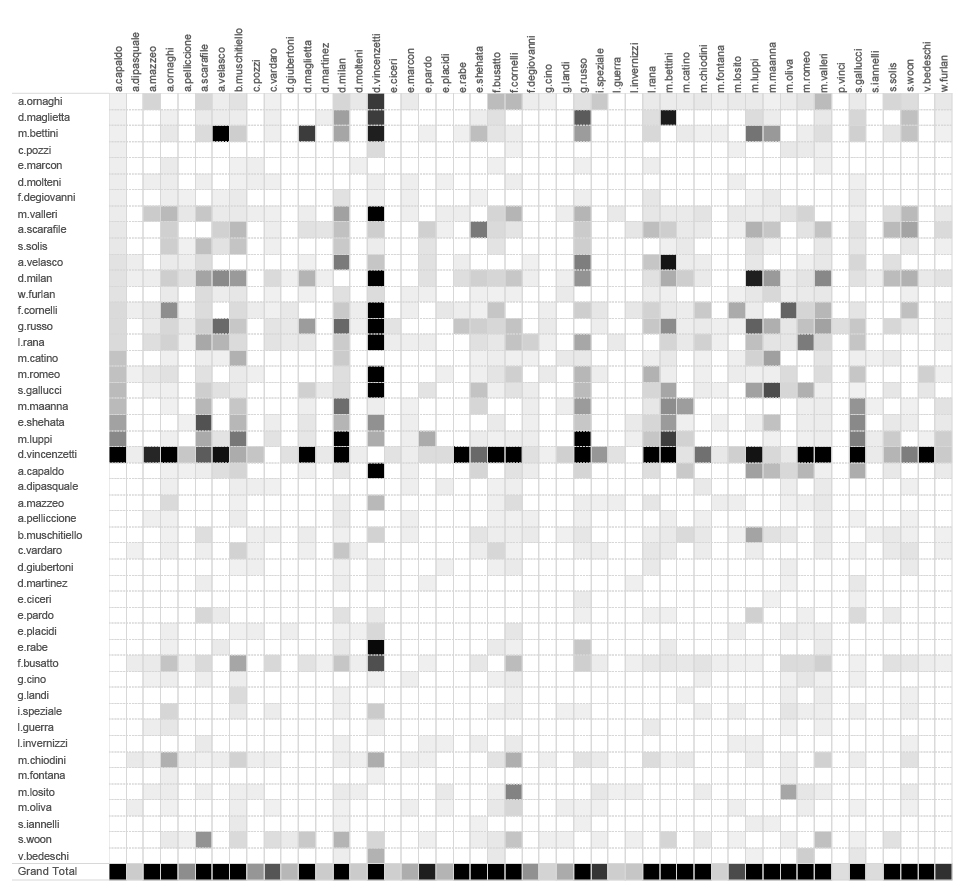
By spotting the darker squares we can explore individual ties between different employees within organisation. D. Vincenzetti is clearly the main actor in this graph, but we can also notice a few other strong relations across this heatmap, that can help us get a better insight into their organisational structure.
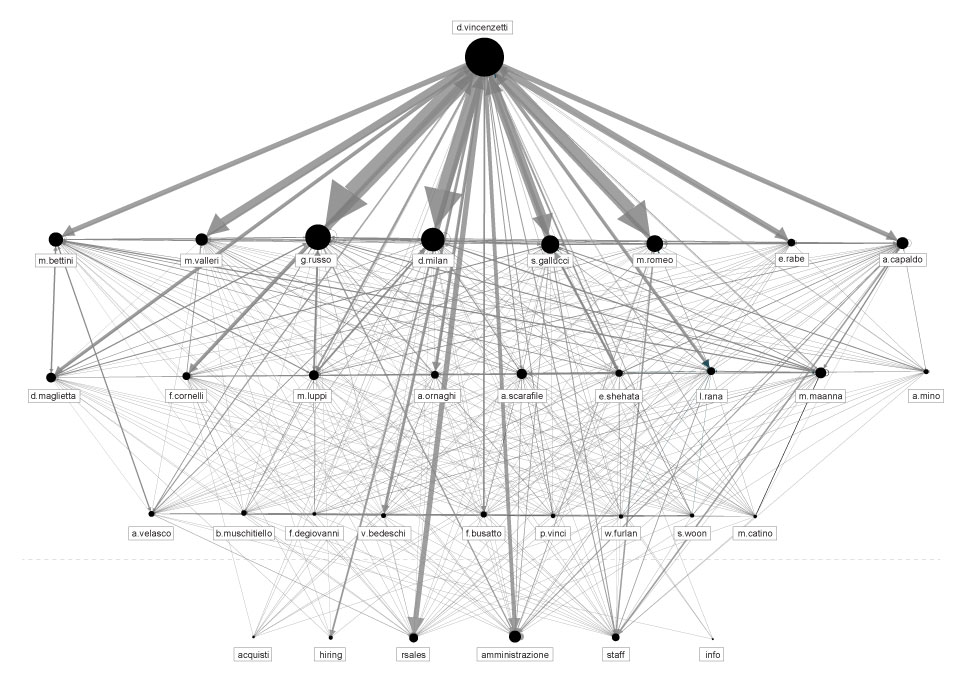
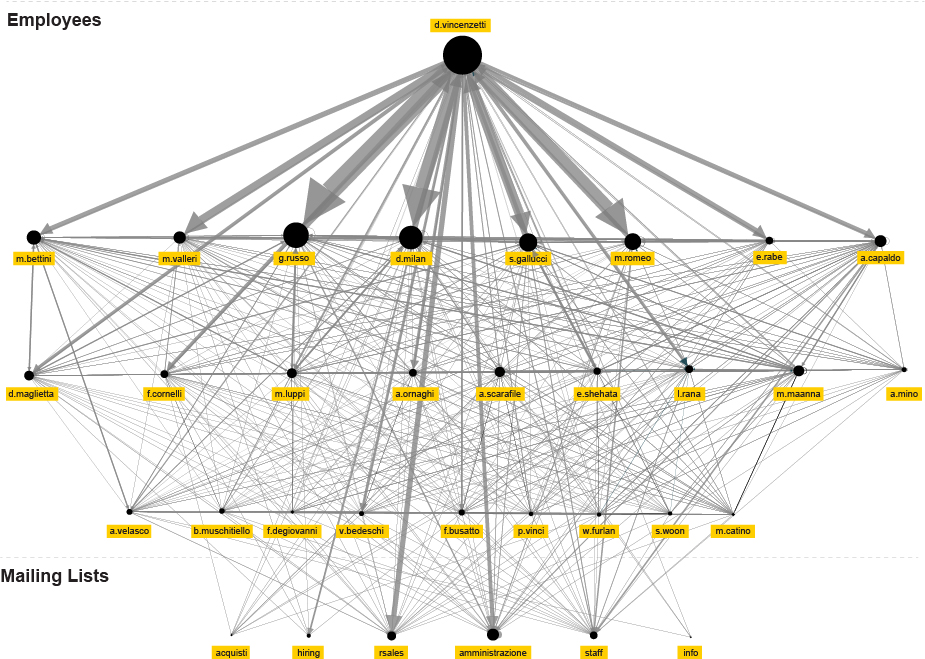
Finally, using the insights from both visualisation methods, we are able to shape a communication chart that might represent a credible representation of the organisational structure. It probably doesn’t display relations that are in accordance with what is written on their business cards, but on the other hand it probably represents real relations between people within the organisation better.
Potential organisational structure based on the level and direction of communication
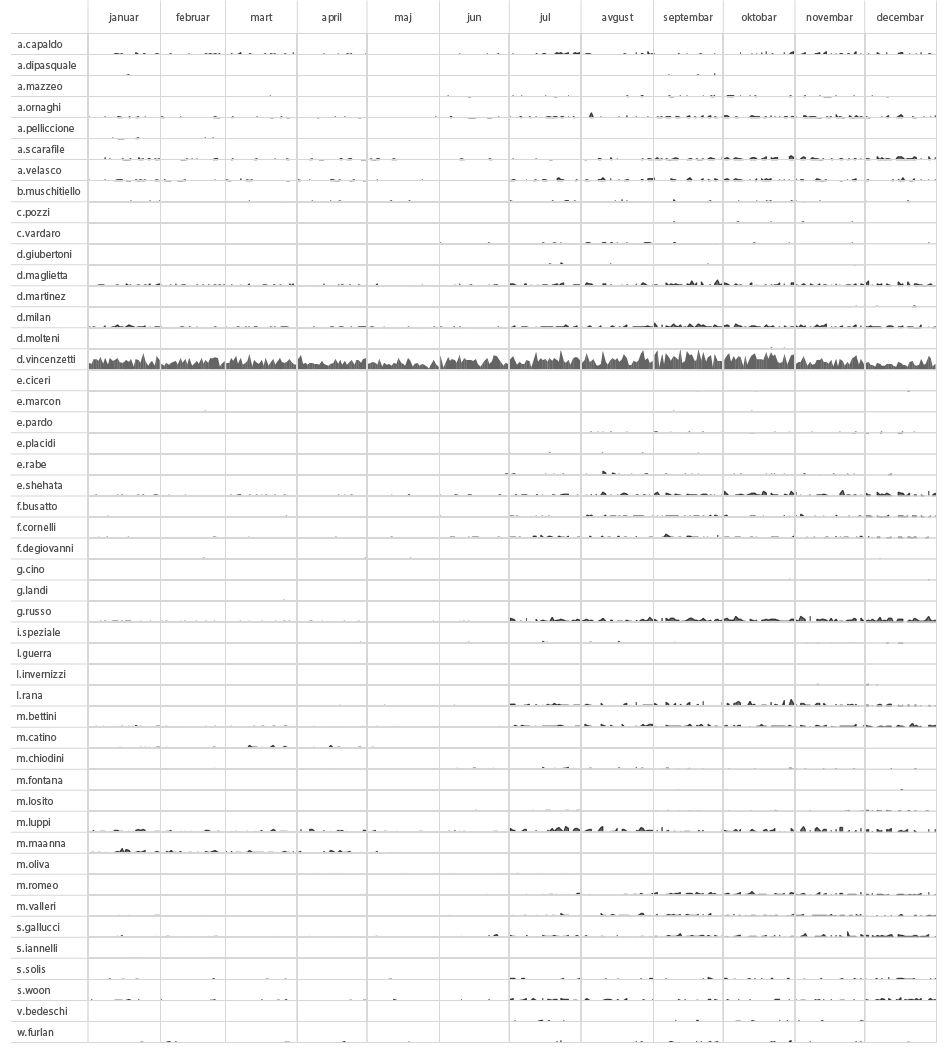
Setting aside the organisational structure, if we were to add another interesting piece of information retrieved from metadata – the time component, we would be able to track the activity of every individual employee in time, based on the number of sent messages from each one of them. Having done this, we created the following activity chart. With this kind of analysis you could, for example, speculate or determine which part of the year is the busiest for the organisation or, combined with other information inputs, when certain employees went on vacation or took a leave of absence.
Number of sent emails per HT employee in time (2014)
Exploring External Contacts
Even more interesting, or relevant for investigative data journalism and our effort to understand the nature of the organisation that we are investigating, are probably the external contacts.
In our set of data that means around 4600 different individuals that exchanged emails with Hacking Team employees in the course of 2 years.
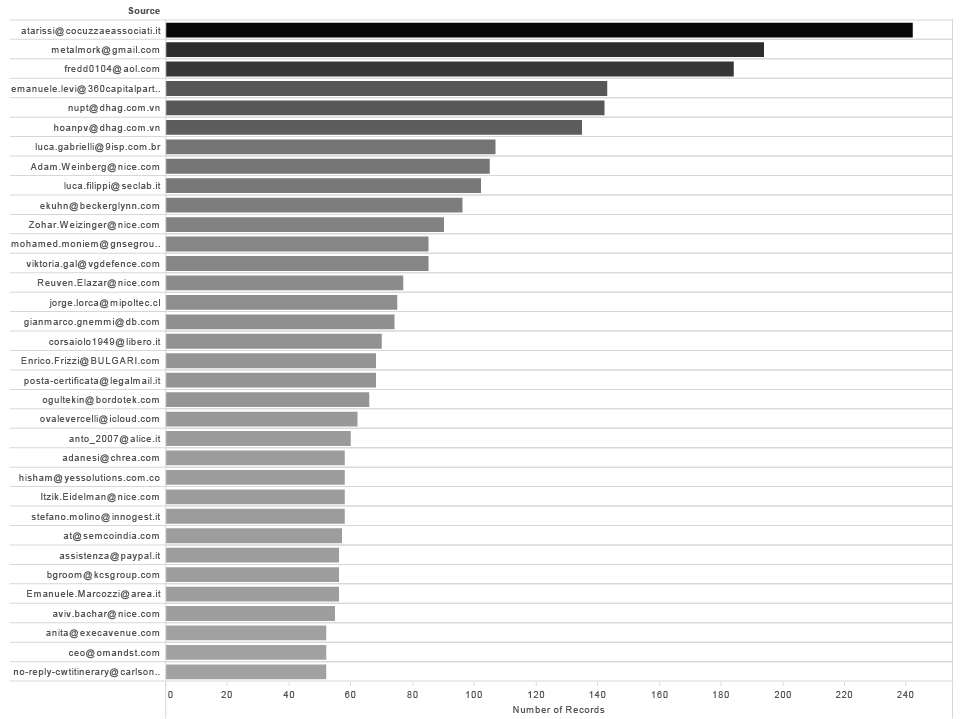
If we exclude all the @hackingteam.com adresses and rank results by the number of records we are going straight to the point. This is the list of Hacking Team contacts with more than 50 emails exchanged.
External contacts with more than 50 emails exchanged with HT Employees ( 2014-2015 )
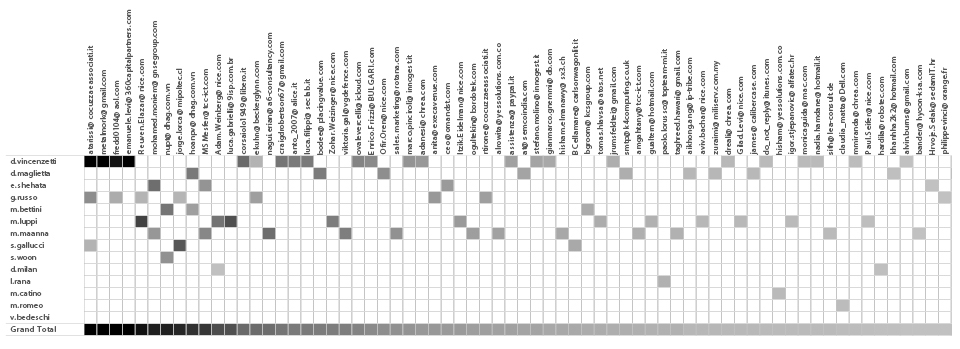
If we add the Hacking Team employees on the other axis, we will get information who in the team communicated with external contacts and how frequent and strong the communication was.
Number of emails exchanged (>30) between HT employees and external contacts ( 2014-2015 )
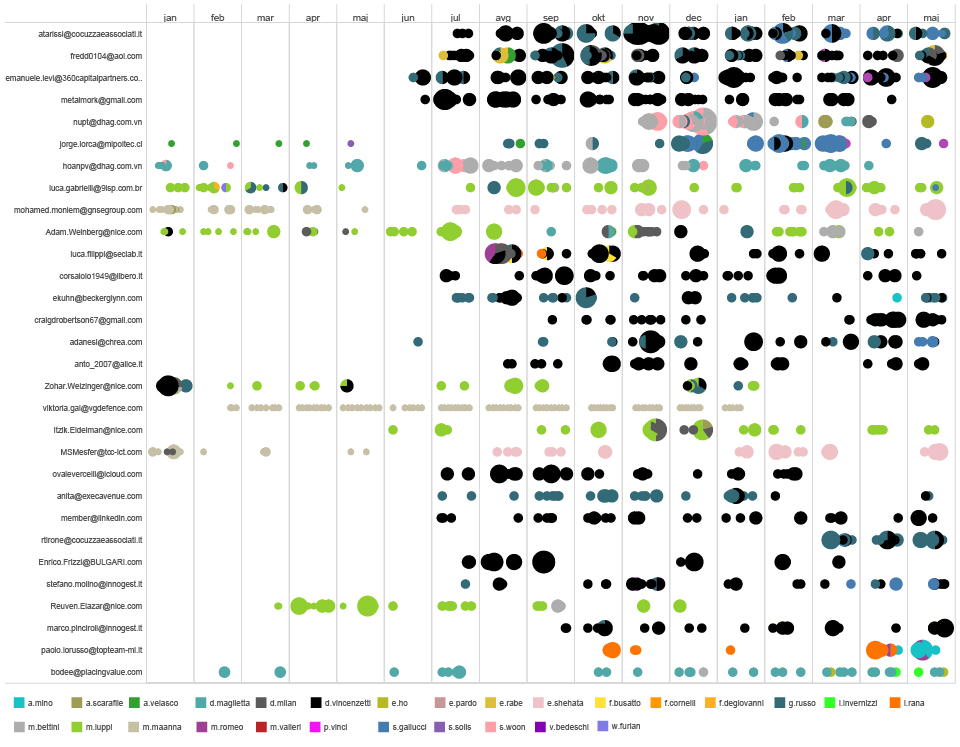
Additionally, if we add the time component, we have a complete overview of who communicated with whom and when.
Timeline of individual communication of external contacts and ht employees ( 2014-2015 )
We grouped the emails by domain, and after some research about the companies behind the domain names, we classified them by the type of service they officially provide.
external contacts grouped by the domain name based on the d.vincenzetti emails
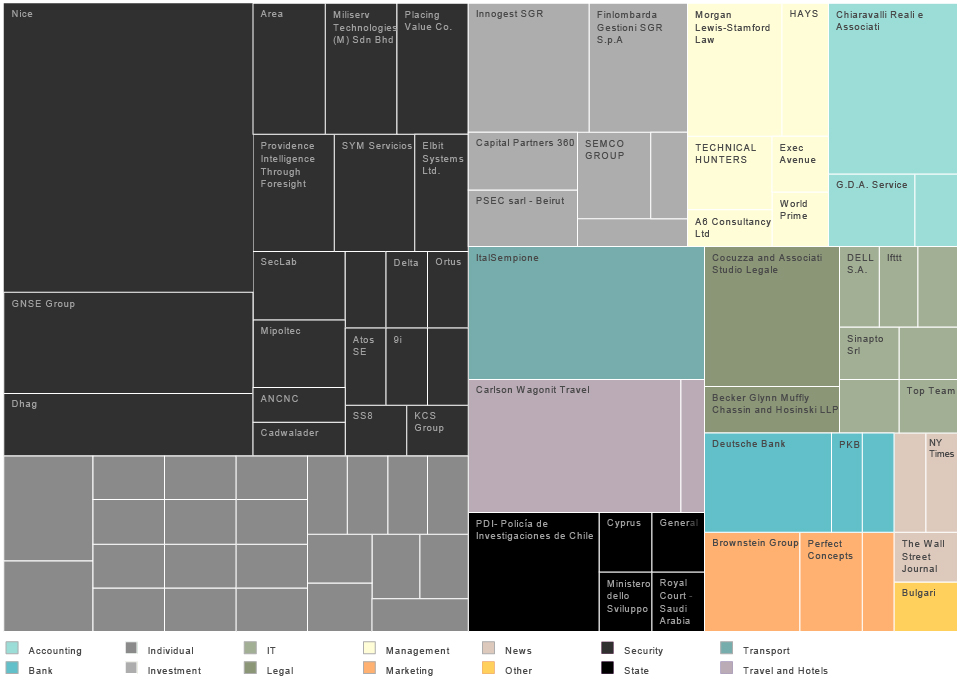
According to this treemap the biggest group of organisations collaborating with HT are from the “digital security” sector, followed by individual contacts, i.e. “consultants” and venture capital companies.
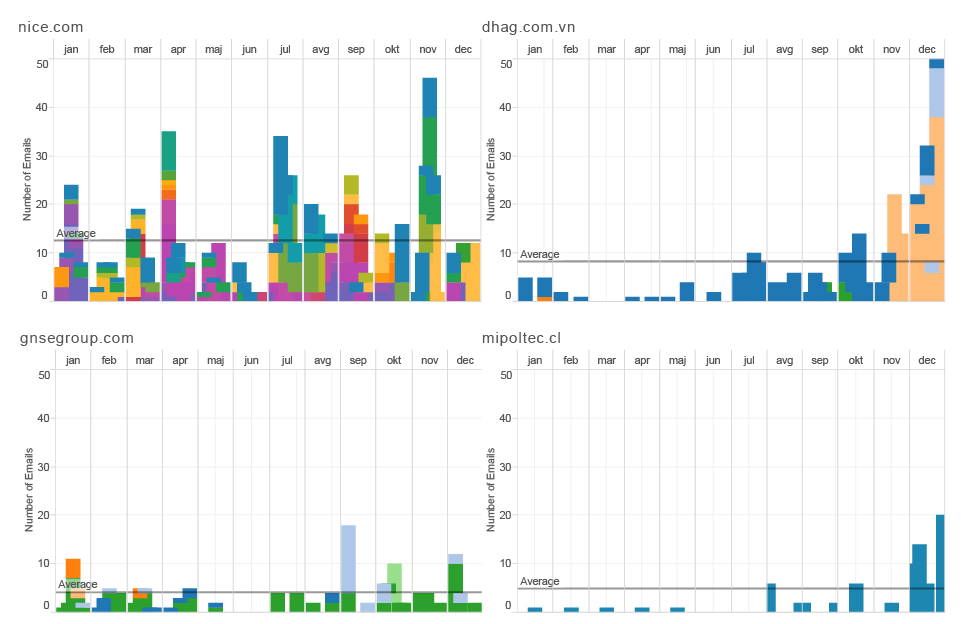
We can explore the relation between selected companies and Hacking Team in time.
Timeline of selected companies email communication with ht employees (2014)
Pattern of life
Humans are amazing pattern-recognition machines. We are constantly analysing complex sets of inputs, and making decisions based on facts we previously encountered or learned. But in recent years, we are not the only ones who analyse patterns around us, we are becoming more and more the object of analysis, mostly performed by machines and algorithms.
The unique way we interact with the technology we use, the unique set of contacts we have or our unique behavioral patterns define our metadata signature, our fingerprint. In the eyes of the algorithmic analysis every single person is unique.
Pattern-of-life analysis is a method of surveillance specifically used for documenting or understanding subject’s habits. It is a computerised data collection and analysis method used to establish the subject’s past behavior, determine its current behavior, and predict its future behavior. This form of analysis is generally done without your consent, and it’s applied not just in the security field, but it is a core activity and business model of many of the biggest Internet companies. More commonly, pattern of life analysis is called profiling. Inputs for this analysis are in most of the cases our metadata collected from emails, IP traffic or data from mobile phones and other technology we use.
Even though we are just limited to email metadata in our research , we will try to perform pattern of life analysis on one key figure from Hacking Team and try to see what we can get.
According to the previous phases of our metadata investigation, an obvious choice of a node (person) with the biggest amount of internal and external contacts and communication is [email protected]. We will call him Mr.D.
We are trying to understand 3 main things here:
What is the behavioural pattern of Mr.D ?
What are the anomalies in this pattern?
How different the behavioural pattern of Mr.D is in comparison to his social/professional circle?
pattern RECOGNITION : sum of Mr.d sent and received emails per hour during the day (2014)
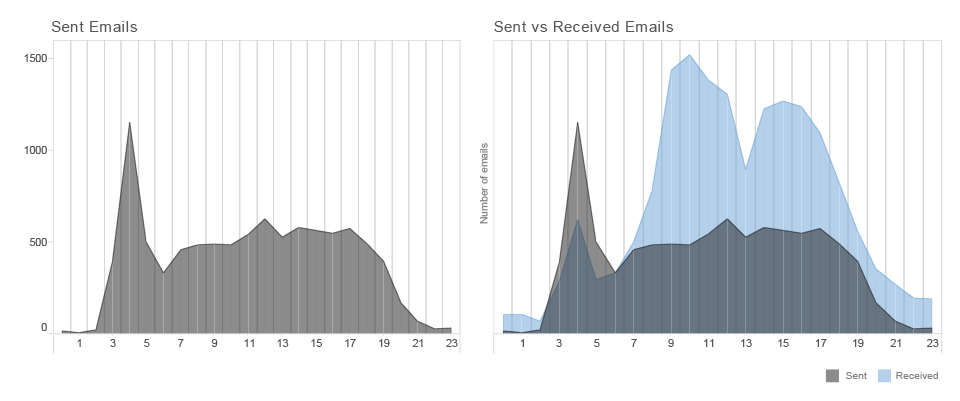
Sent emails represent the behaviour of the person that we are examining and received emails represent the overall behavioural pattern of his social or professional environment.
Mr.D is not the same as other people.
He starts his activities quite early in the morning. Almost every day around 4 a.m. is his time of concentration, the moment when he sends the biggest amount of emails during the day. If we are comparing the number of sent and received emails we can see that Mr.D has different habits than most of his contacts. His social and professional circles are most productive around 10 a.m., most of them have a lunch break around 1 p.m. and their productivity rapidly declines from 4 p.m. On the other hand, Mr.D doesn’t have a big swings of productivity during the day. His peak during working hours is at noon. It looks like he doesn’t have a regular lunch break and when his co-workers and external contacts start to lose concentration in the afternoon, he has another peak of activity around 5 p.m.. Additionally, Mr. D seldom sends any emails after 8 p.m.
PATTERN RECOGNITION : SUM OF MR.D SENT AND RECEIVED EMAILS PER week days and months (2014)
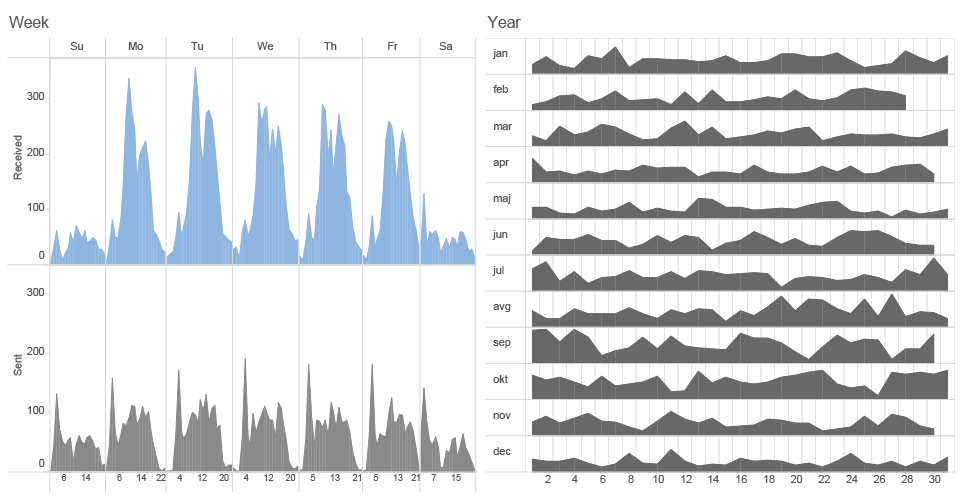
If we are analysing Mr.D’s behavioral patterns on a week’s scale we can find out that he is even working much more than his professional circles during the weekend as well. It looks like his only time out of emails is every saturday during lunch time around noon.
That is Mr.D’s average behavior, but what is even more important to our analysis are the anomalies in his behavior. Anomalies can point to many things. People are changing their behaviour when depressed, sick, working under pressure, when there are some deadlines or important events, when they are traveling or when they fall in love, for example.
ANOMALY detection : number of MR.D sent emails per hour (2014)
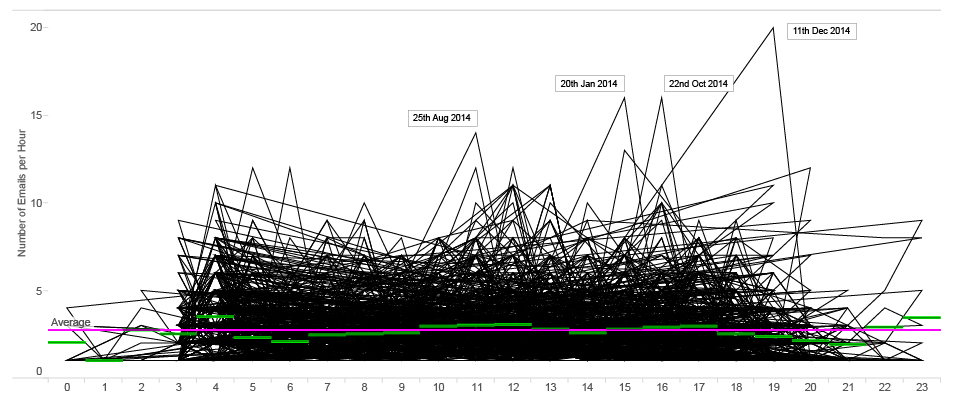
On this graph we can see some spikes that represent anomalies in Mr.D’s productivity.
For example, on the 11th of December at 7 p.m., he sent 19 emails during one hour compared to average 2.7 emails that he usually sends.
The following heatmap is probably most effective for spotting anomalies.
pattern RECOGNITION and ANOMALY DETECTION : heat-map of mr.d sent emails per hour (2014)
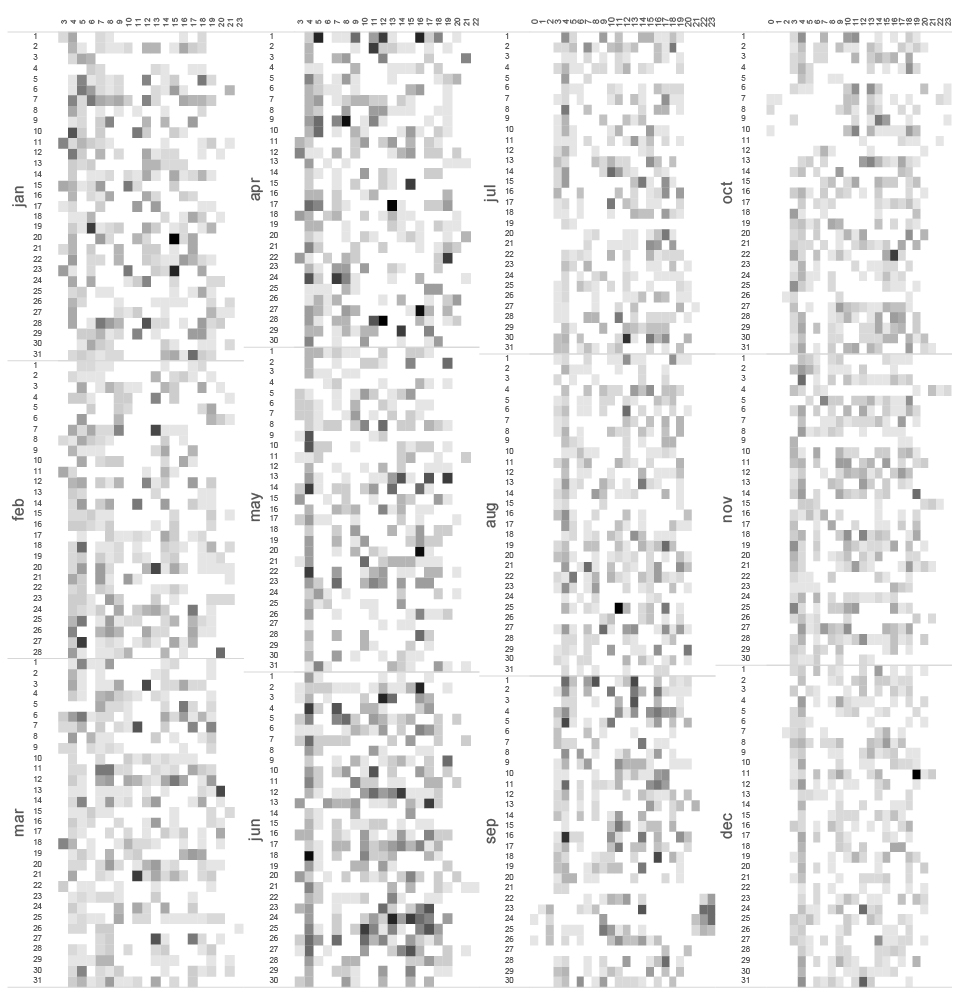
Looking at the heatmap, you can spot an interesting anomaly in September. On the 20th in the afternoon we see a really low level of activity, which is unusual for Mr.D, giving that we already know that his daily productive peak is around noon.
Further, on September 21st from 4 a.m, when he generally wakes up and starts work, there is no activity until the day after at 7 a.m.
In the next few days we see that the pattern is uncommon. It looks as if Mr.D sleeps in the afternoon and works intensively during the night. On September 27th, we can see again a lack of communication and then in the following days, Mr. D’s pattern is back to normal. Based on the other metadata inputs that we will explain later in our research, we found out that Mr.D was traveling to Singapore between the 21st and the 27th of September. With that we can easily conclude that a change in the time zone influences Mr.D’s email pattern.
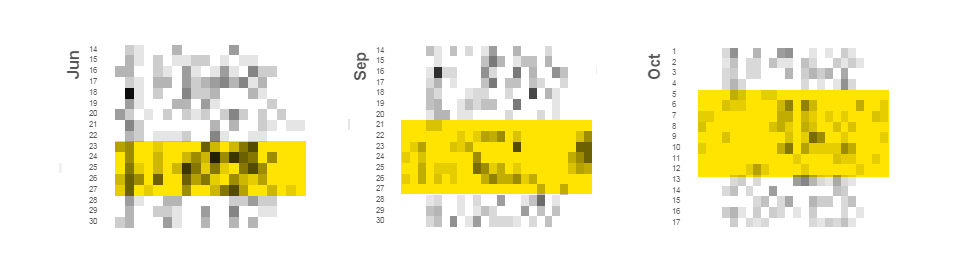
We can find another anomaly in the pattern from October 5th to October 12th, but this pattern looks a bit different, it swings in another direction. On this occasion Mr.D went to the USA and it showed us how different time zones leave different footprints in his pattern.
There is also one really interesting pattern anomaly on June the 24th and the following day (you can see darker squares and an increased level of communication). On that day, researchers from Citizens Lab published analysis “Police Story: Hacking Team’s Government Surveillance Malware” exposing the functionality and architecture of Hacking Team’s Remote Control System (RCS) in a never-before published detail. This report had a great media coverage, including media such as The Economist, Associated Press, Wired, VICE, International Business Times, Forbes and others. We can see how this stressful event for Hacking Team reflects on the pattern of Mr.D’s emails.
Mysteries of the Subject
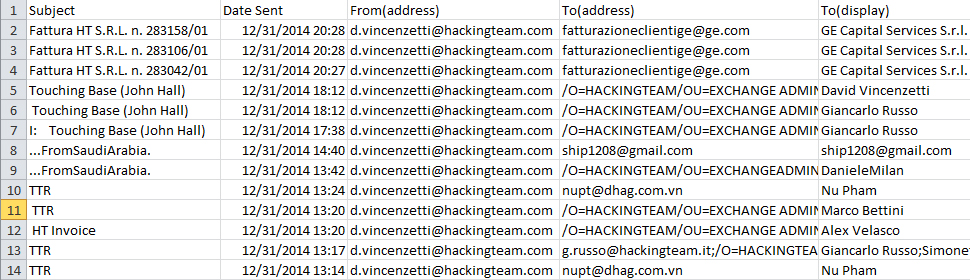
Aside from the defined activity patterns and discovered anomalies, email subjects also reveal a very detailed overview of Mr.D’s communication with other employees of Hacking Team.
timeline of emails sent from mr.d to individual ht EMPLOYEES in 2014 ( hover on graph for subject line )
TOOL : TABLEAU
Just to make a short but interesting digression: while creating this graph of email subjects we stumbled upon the moment A.Pelliccione left Hacking Team in March 2014. At this moment his communication with Mr. D stops. Based on the IP location data that we will present later, we also found out that he moved to Malta and started communicating through a different email address – reaqta.com.
We can argue whether the email subject should be considered metadata or not. However, looking from a technical point of view, the subject is a part of the header in the same way as other types of information (From, To, Date, etc.). Basically, it’s just a matter of choice of the person who is to analyse the metadata. For the intents and purposes of our research, we will consider the subject a legitimate source for metadata analysis.
timeline of subject lines ( 2014 )
TOOL : TABLEAU
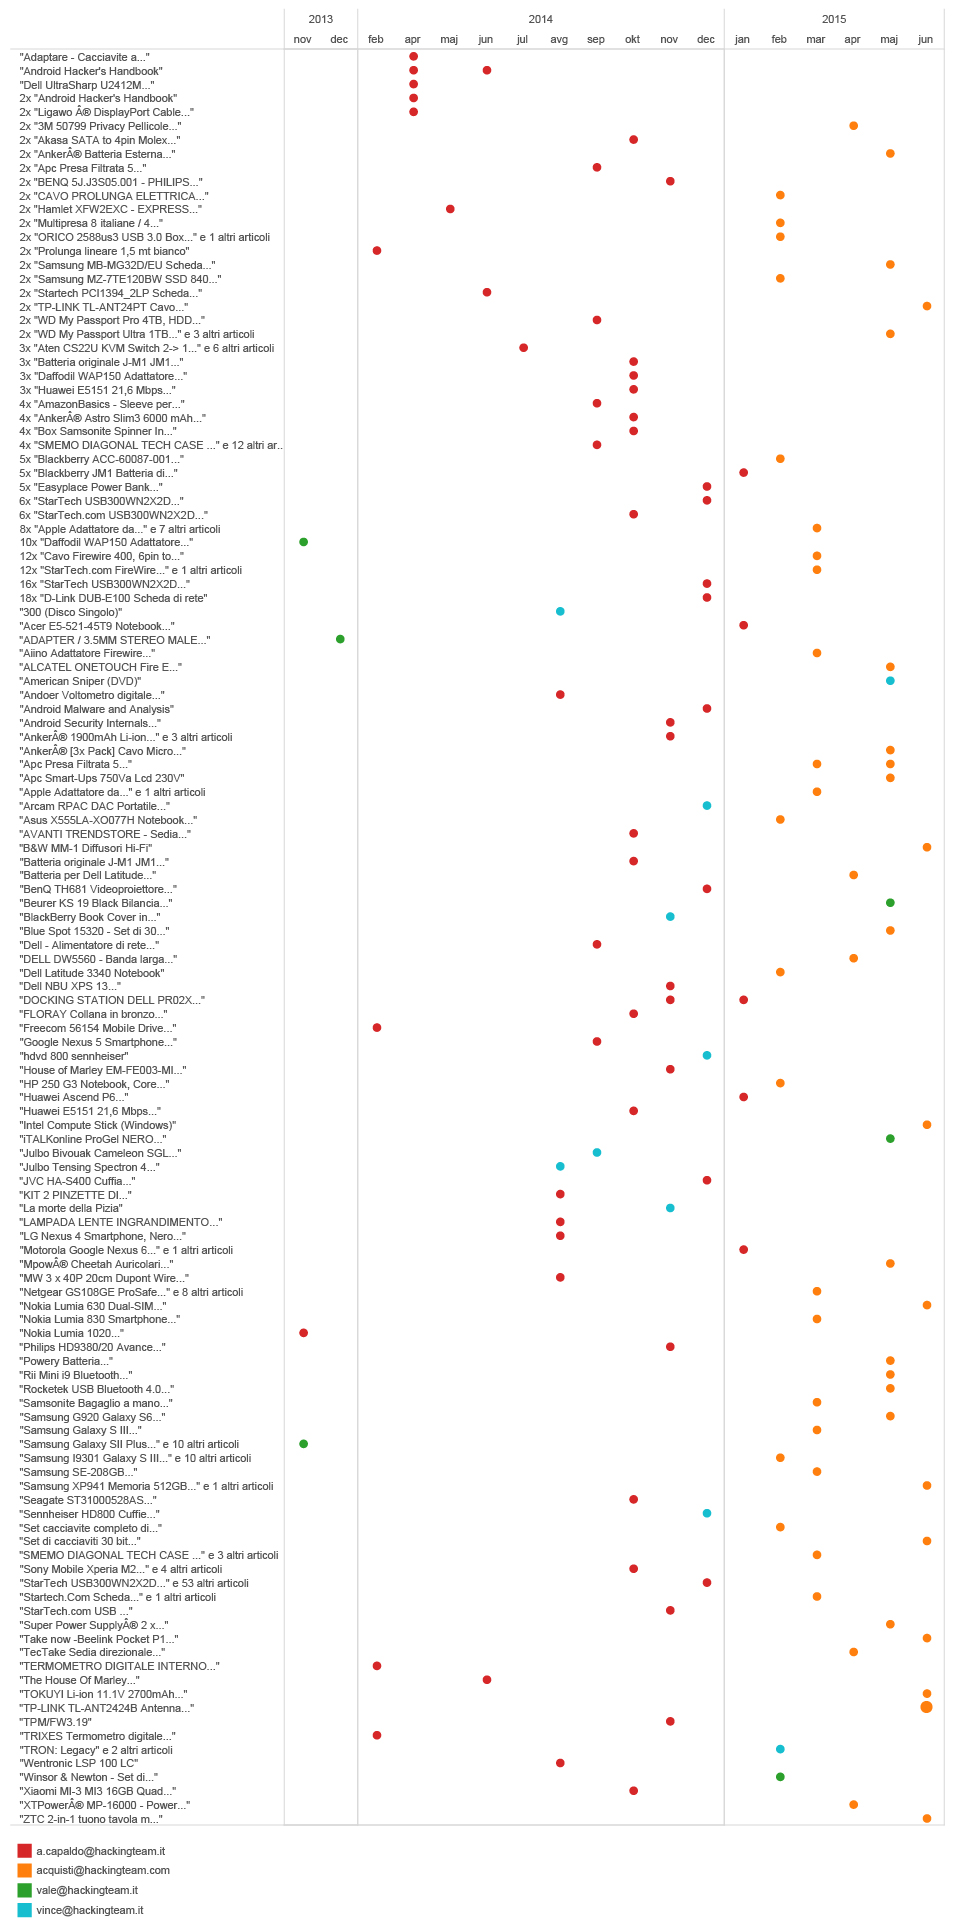
Getting back to email subjects, they can sometimes give us some really amusing information. For instance, many companies such as Amazon, list the ordered items in the subject of a Confirmation email you receive after your payment has been processed.
By extracting the emails sent by Amazon to Hacking Team employees, we were able to get an insight into their purchases.
timeline of emails with subjects from amazon.it
But there are some more extreme examples.
If we look at the treemap of Hacking Team partners, there is a company called Carlson Wagonit Travel. According to the company’s website, they deliver solutions for business travel, meetings and events management. For HT they arrange and buy plane tickets, book hotels and provide travel assistance. They have one bad habit (which is quite common for many booking agencies), every time an airplane ticket is booked, the agency would send an email with name and airport codes, contained in the subject line, to the prospective passenger. Extracting that information from the subject and cross-referencing with the date the email was sent, we are able to get an approximate information about the journeys of HT employees.
The list of Hacking Team frequent flyers and locations they visit looks like this.
map of ht employees flights based on cwt emails subject lines
TOOL : TABLEAU
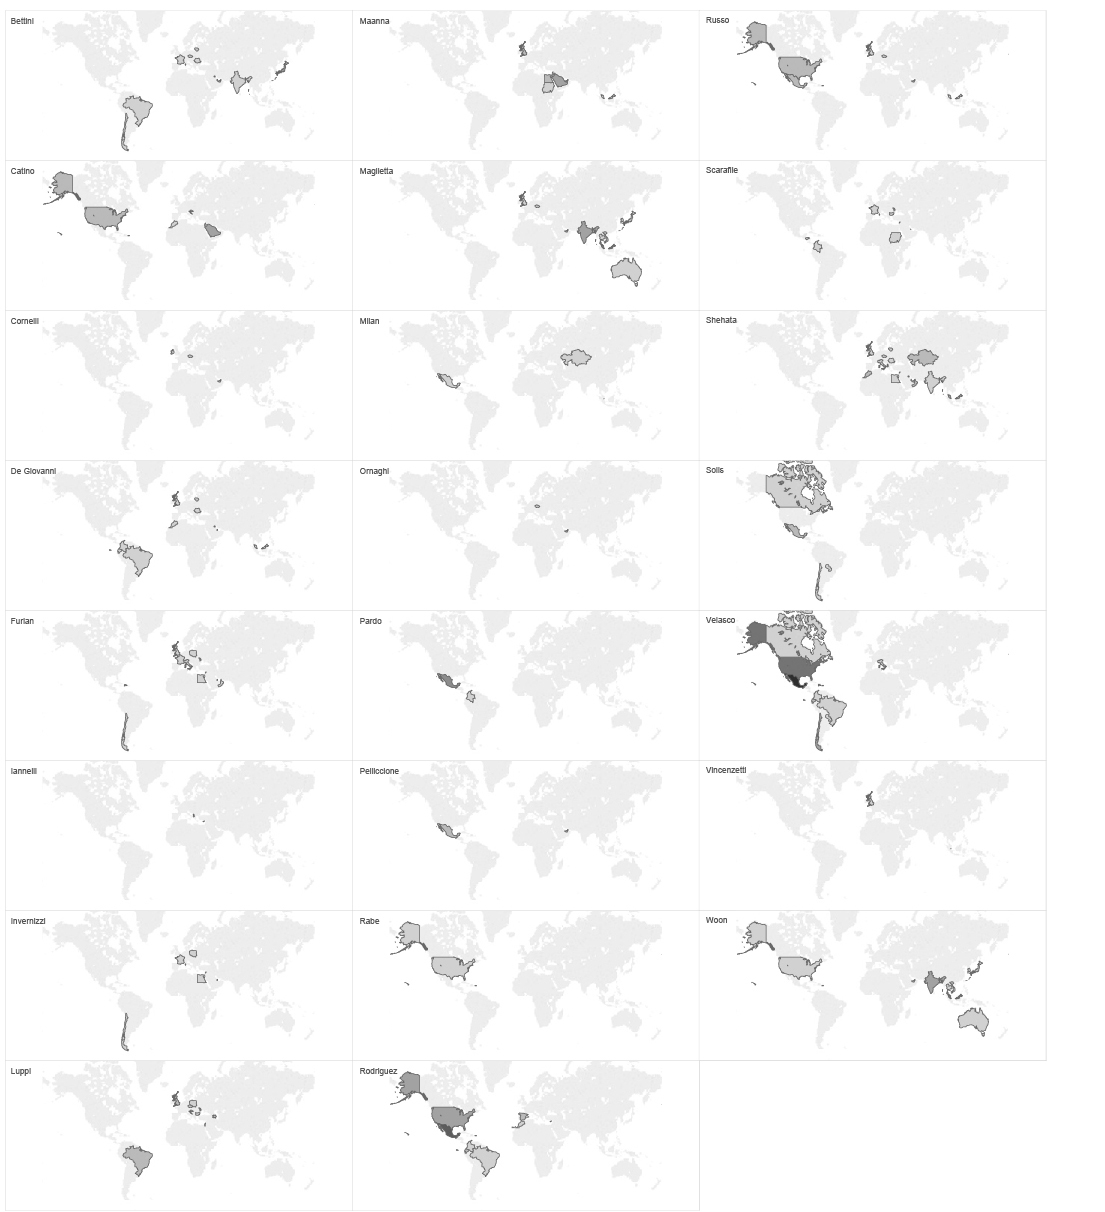
These data give some interesting information related to our assumption of how the organisational structure of Hacking Team looks like. If we go back to our organisational structure graph based on social network analysis and compare with this list of frequent flyers, we can see that the most frequent flyers are not very high in the hierarchy according to our network graph. However, if we group the flights by passenger’s name, we realise that each of the most frequent flyers is based in a certain place, and covers a certain region/market, such as SE Asia, Middle East, South America etc. Conclusion that we can get from this is that those employees are responsible for certain markets or regional Hacking team offices around the world.
individual ht employees flights map based ON CWT EMAILS SUBJECT LINES
If we regroup the same set of data, by location, we can see at which point in time and where two or more Hacking Team employees have met or have traveled together. This implies potential business meetings, sales of surveillance tools, establishing new relations with international customers and government agencies around the globe.
timeline of INDIVIDUAL HT EMPLOYEES FLIGHTS to different countries BASED ON CWT EMAILS SUBJECT LINES
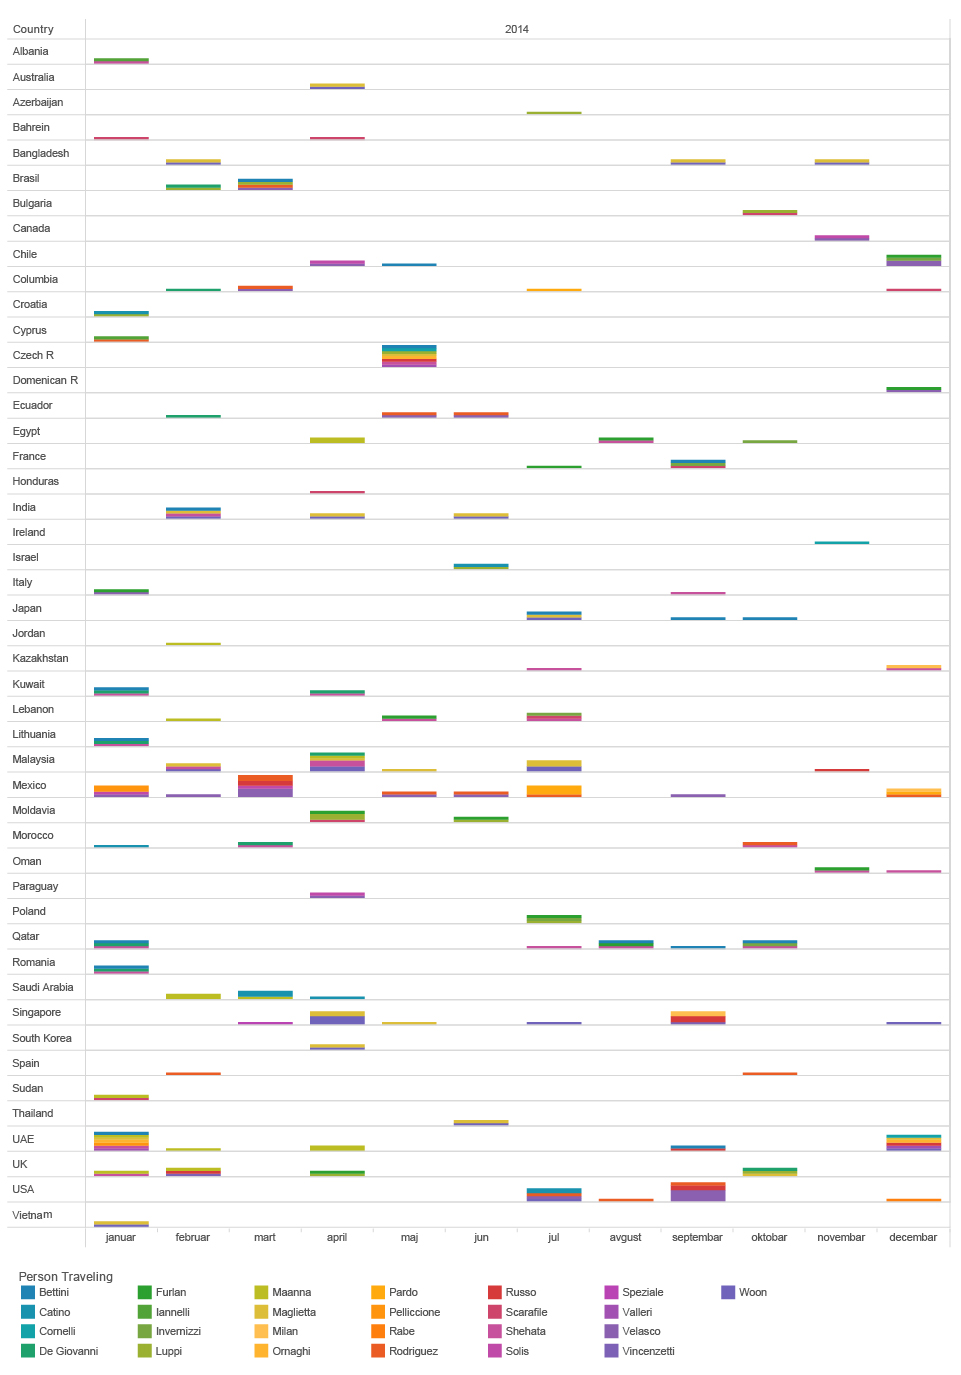
TOOL : TABLEAU
Homing pigeon
The email header hides one even more precise location information. In some cases, the email headers reveal the IP address of the sender. The IP address can then be geolocated, using some publicly available tools, to the level of a city or individual router. In the context of our investigation, this allows us to trace every one of Mr.D’s contacts. Every time someone sends an email to Mr.D, that person basically reveals their location to us. Just by analysing the metadata of Mr.D’s received emails we can get information where the senders are located, when they changed city or country.
This allowed us to locate even more precisely in time all employees of Hacking Team.
timeline of hT employees ip locations based on emails received by mr.d (2014-2015)
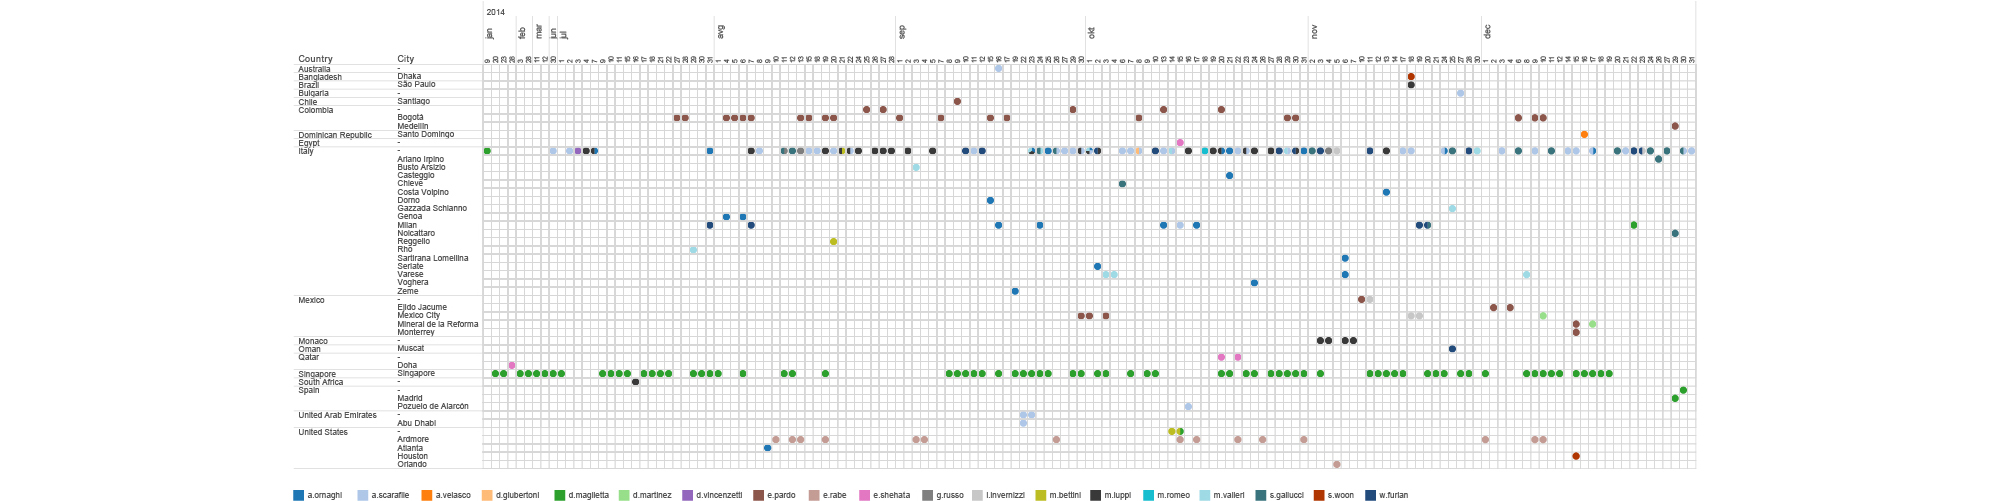
We can see for example, that most of the employees are located in Italy, but there are some of them being situated in different places around the world.
D.Maglietta is for example head of their office in Singapore but he spends Christmas in Spain. E.Pardo is in Bogota, Colombia most of the time and he had a visit from another HT employee A.Scarafile on January 14th. We can see how E.Shehata jumps around the Middle East visiting Qatar, Lebanon, United Arab Emirates, Egypt and Jordan. E. Rabe is situated in Ardmore, PA, USA but moved on February 14th to another suburb of Philadelphia. And finally, even though HT claims to have an office in Washington DC, based on metadata we didn’t find any evidence that would support that.
On a World map, the distribution of their locations looks like this.
map OF HT EMPLOYEES IP LOCATIONS BASED ON EMAILS RECEIVED BY MR.D (2014-2015)
TOOL : TABLEAU
Locations of the external contacts of Mr.D give us a real insight into their global operations.
MAP OF external contacts IP LOCATIONS BASED ON EMAILS RECEIVED BY MR.D (2014-2015)
TOOL : TABLEAU
This tiny piece of information allows us to explore individual contacts in each country, to find their main partners, even to track locations of their contacts in time.
MAP OF EXTERNAL CONTACTS IP LOCATIONS ( ZOOM or move map to explore other regions )
TOOL : TABLEAU
It’s Just Metadata
More often than not, the power of metadata is being taken naively or its potential usage is being oversimplified in comparison with the content of our communication. But we see that even our not very sophisticated, DIY methods, enabled us to create a deep and clear image of someone’s habits and activities, using information extracted from ‘only’ email metadata. Although our investigation primarily discovered relations, patterns and anomalies of someone’s work life, it still gave us an insight into that person’s habits that border with private life. In the end, metadata scans someone’s behaviors on a much deeper level than traditional surveillance practice related to content could ever do.
At moments, while conducting this investigation, it certainly felt as if we were peeking into the deepest corners of someone’s life. What felt even more disturbing is the idea that our subjects of analysis are probably less aware of their behavioral patterns that we are. It’s just metadata, and in our case just one little segment of it. This is why our research provoked an internal debate within our team on the ethical issues of this kind of practice and on the form in which the findings of this research should be published. On numerous occasions, supporters of NSA surveillance programs, claimed that collecting and analysis of metadata is not surveillance. According to our data exploration, we can claim that it can be even more intrusive than regular content surveillance.
Who has access to metadata?
Understanding who has access to metadata and the possibility to analyse it will give us an answer to the question of the new power structures and distribution of wealth in the information society.
The first and obvious group are the companies that provide services such as Google or Facebook. They don’t just have access to the metadata, they have actual data and content on their servers. Quality, variety and amount of metadata that for example Google owns about every user of his services, stored in gigantic datacentres are unprecedented MONOPOLIES OF COLLECTIVE DATA. Through their core business models they are pioneers of metadata exploitation. It could even be said that the first data centre setup by Google in 1998 can be considered the milestone of the birth of the metadata society.
The second group with access to metadata is related to the the internet’s infrastructure. Those are Internet service providers, mobile service providers, Internet exchange points and submarine optic cables and they can access data when it flows through their cables, routers and servers. The quality of metadata that they can collect depends on the endpoints attached to the infrastructure, but in any case they have access to the basic metadata of the internet packets. Even though the content of, say, emails, is supposedly encrypted (at least when using these mainstream services), the metadata is not, because the email architecture simply has to rely on metadata that are readable, as explained before.
National Laws in most cases give the Government or some of the Agencies thereof a legitimate access to users’ data, including email and other metadata. Internet infrastructure owners or companies that provide services are obliged to cooperate with Governments whose jurisdiction they are under. They often comply with Government requests and have different forms of technical cooperations. However, in many countries Government agencies have invested in developing programs for mass surveillance of citizens based on collecting metadata. These programs often rely on software that creates and exploits backdoors (as is Hacking Team’s case) or use some other creative way to get access to metadata.
Those are the hunters, hoarders and scavengers in the ecosystem of the metadata society, but there are some smaller species worth mentioning as well. Metadata is often a resource for different businesses based on data collection and analysis in the field of digital marketing, business analytics or scientific research. You can even be a subject of surveillance in your work environment. The company you work for could perform metadata analysis of your productivity, anomalies in your behavior during work time and analysis of your contacts. To name an example, this kind of internal company surveillance service is provided by one of the Hacking Team main partners – Nice, mentioned earlier in this text.
Understanding the power of metadata brings us closer to understanding the algorithmic governmentality as a concept and practice. The quality of metadata is that it is really easy to process and it can be done by machines and algorithms. In the eye of the algorithm, we are observed through our profiles, sets of behavioral patterns and anomalies extracted from our metadata. Automatic processing and algorithmic analysis of those data in real time leads to the world in which algorithms can decide whether we are terrorists or regular citizens, are we suitable for a loan in the bank, an insurance policy, or who is going to appear in our social stream. Algorithms can eventually predict our future behaviour based on our past metadata, bringing us closer to the concept of pre-crime, the tendency in criminal justice systems to focus on crimes not yet committed.
We are not going to conclude anything about Hacking Team’s activities, because that was never the goal of our research. We wanted to understand, hands-on, through research and practice how metadata analysis can be performed and what we can learn from it. We hope that researchers and investigative journalists can use our data and exploration for their own research and that they will be able to find new connections and leads based on metadata.
Contributors